AIR FREIGHT
Worldwide air cargo capacity is up by +9% year-on-year, with significant increases from Asia Pacific and Central & South America, while average rates remain above pre-COVID levels, indicating a robust recovery in the sector.
The air cargo market evolved in a surprisingly positive manner over Q1 24. Overall, tonnage increased by more than 10% compared with the same period last year, with growth on all main trade lanes.
The first quarter of 2024 has created a positive dynamic in the market and enhanced confidence levels, especially in the short term.
For Q2, the demand is strong and capacity is expected to remain adequate on most trades, although there are pockets of shortages, as is currently the case in India.
This, in general, leads to maintaining prices at levels higher than initially forecasted.
Actually, global airfreight demand maintains momentum despite traditional seasonal dips, fueled by Asian exporters opting for air transport due to delays in ocean shipping around the Red Sea.
Chinese e-commerce giants contribute significantly to the surge, with robust shipments to Europe and North America.
Air cargo volumes have seen consistent double-digit growth for several months, indicating a robust recovery from previous downturns.
While some regions experience minor declines, overall volumes remain strong, driven by diverse factors such as flower shipments from Central and South America and increased demand for consumer goods. Amidst capacity increases and rising rates, the industry anticipates sustained growth, particularly in e-commerce-related shipments, leading up to the busy shipping season in September.
Estimates for airfreight growth range in 2024 from 2% to 5%, but the continuing influx of passenger widebody capacity, especially in the Asia-Pacific region, as airlines reset after the pandemic, is expected to put pressure on load factors and rates.


SEA FREIGHT
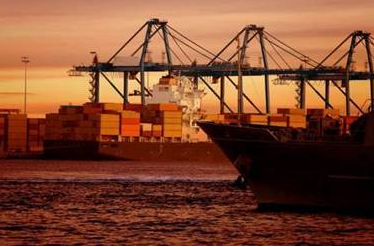
As the weeks go by, demand for maritime transport is strengthening as an exceptionally early peak season is taking place, particularly linked to extended transit times due to the situation in the Red Sea.
Besides, the rise in rates at the beginning of the year led many shippers to postpone their shipments, in the hope that rates would come down again.
That was a bad move: the market is booming.
As a result, spot rates have further dramatically increased and the increase will continue, due to
- increased demand,
- limited capacity
- the need to reposition empty containers
Not to mention that GRIs (General Rate Increases) are planned for June 1st.
From Asia, ships are full at least until mid-June, yet another sign of an ultra-tight market.
At the same time, shortages of containers (notably 40' HC) are starting to emerge in China and elsewhere in Asia, the same than at the height of the post-Covid recovery.
And this imbalance is itself a factor in port congestion.

As of May 21st, ocean rates from Asia to Europe are up 198% year over year, and from the Far East to the West Coast of the US, the increase is 214%.
And counting.
In the context of continued strong demand, the risk of port congestion and deterioration in quality of service remains very high... which will only push rates even higher.
The average punctuality of ships on the Asia-Mediterranean trade certainly improved a little in March, but it remains particularly mediocre (40%).
The resulting increase in freight rates and diminished service reliability, as longer transit times cost more, have led to ports becoming congested, capacity being contracted with vessels placed upon longer transit loops and equipment shortages developing.
These problems have been further compounded by a surge in booking volume and vessel operators prioritising higher-paying freight, moving equipment, and capacity to suit.
While spot rates have risen and remain considerably higher than they were a year ago, costs have also increased.
Due to longer journeys, increased sailing speeds, and additional fuel costs have resulted in surcharges that have been passed on to the shippers.
For instance, Maersk said fuel usage per journey has risen by 40%, and charter rates are three times higher, often fixed for five years.

How the Red Sea crisis is worsening the carbon footprint?
The list of negative impacts of the Red Sea crisis continues to grow.
In addition to the increase in transit times, the effect on freight rates and the return of port congestion, the situation also degrades the carbon footprint of maritime shipments from Asia.
Excess fuel used by shipping companies to circumnavigate Africa to the south accounted for 13.6 million tons of additional CO2 emissions over the past four months, according to a subsidiary of the Boston Consulting Group, Inverto.
This is the equivalent of the cumulative emissions of 9 million cars over the same period...
Transport's carbon emissions increased by 63% in the Asia-Mediterranean trade in the first quarter of 2024.
To this must be added at the same time the growing use of air freight or sea-air solutions.
The final aggravating factor is that shipping companies have simultaneously increased the speed of container ships in an attempt to contain transit times to Europe.
USA: SECTION 301 TARIFFS INCREASE
The White House announced in May an escalation in tariff rates on key imports from China under Section 301 of the Trade Act of 1974.
The new measures will affect $18 billion in imported Chinese goods.
Therefore, the USTR will be directed to maintain all existing tariffs on Chinese imports and impose new tariffs on a range of products, including the following:
semiconductors: from 25% to 50% by 2025
certain steel and aluminum products: from 7.5% to 25% in 2024
electric vehicles (EVs): from 25% to 100% in 2024
lithium batteries for EVs and critical minerals: from 7.5% to 25% in 2024
solar cells: from 25% to 50% in 2024
rubber medical and surgical gloves: from 7.5% to 25% in 2026


